The Changing Futures programme is a £91.8 million joint funded initiative between Government and The National Lottery Community Fund, the largest community funder in the UK. The programme funds local organisations working in partnership in 15 local areas across England to better support those who experience multiple disadvantage.
Over the last two years, MEAM has brought the local programme leads together for regular discussions about key aspects of the work. In this final set of our blog posts for this series, we reflect on some of the topics covered, drawing on their insight and input from others in the Changing Futures programme and the wider MEAM Approach network.
This special guest version of our blog series was written by Louise Patmore, Systems Change Lead, Changing Futures Sussex & Maud Pedemonte-Ellis, Partnership Manager at MEAM and is meant to be read as part two of two, we published the first part last week.
Systems Pressure Mapping, Finding a New Way
Journey maps[1] traditionally describe a client’s movement through the system retrospectively. But what if they were live? As systems practitioners, we see increased demand for mapping exercises to identify gaps and improve client-service interactions, and they are a good place to start; however, static outputs quickly lose relevance and only reflect organisational perspectives, not the perspectives of the people using the system.
If we could track pathways in real time, we would gain a far more accurate view of how the system responds. Doing so requires both technical infrastructure, like an integrated Dataset with the ability to capture information across a local system and flexibly; and a cultural shift, toward strategic curiosity (looking over the fence between services) risk-sharing, metric-sharing, and organisational trust.
This work began in Sussex as a “Swim Lane Journey Map” and cost-avoidance exercise, motivated by burning platform work in Changing Futures Northumbria. Our full Swim Lane Journey Mapping Project Framework is published on the Changing Futures Sussex website and outlines the full approach taken in Sussex, including the rationale and specific methodology adopted by the project team. We aimed to understand the cost of multiple disadvantage and to highlight cost savings when programme beneficiaries are connected with Changing Futures support. But we quickly realised that cost-avoidance metrics are often crude, disputed and speculative.
For instance, unit cost estimates are largely based on national datasets—the data from Greater Manchester Combined Authority is considered the largest and most well-known —which often felt like underestimates to us, as several factors are not included. A service interaction’s “felt” cost rarely aligns with its “calculated” cost.
To address this, we designed a Pressure Matrix – a tool to better reflect the human cost of service interactions and the wider impacts of the service provision developed by the system. Based on the idea of a journey map, the pressure matrix records interactions over time from multiple parts of the system. However, instead of associating the interactions with a simple £ cost, it applies a three-factor score of ‘pressure’ to capture overall intensity of service use at particular points in time.
What does the Pressure Matrix consider?
Each interaction was initially categorised as:
- Urgent or Non-Urgent
- Statutory or Non-Statutory
- Planned or Unplanned
We also introduced a multiplier effect to account for how many people were involved and how long the interaction took, capturing a more accurate picture of an intervention at a service level.
The pressure index drew from four key factors that are involved in pressure: how much specialist training is required for the intervention, what estate resources and equipment resources are needed and how restrictive or reactive it is. Using a multiplier in this way gave us an index of pressure per activity (for example, an A&E attendance or an instance of peer navigation).
A simple audit tool was then used to input data based on system activity. From this, cost and pressure are automatically calculated per chosen time period (e.g. weekly or monthly). This can then be crosscut in Microsoft Power Bi to give us a visual representation of the activities that can be isolated for analysis.
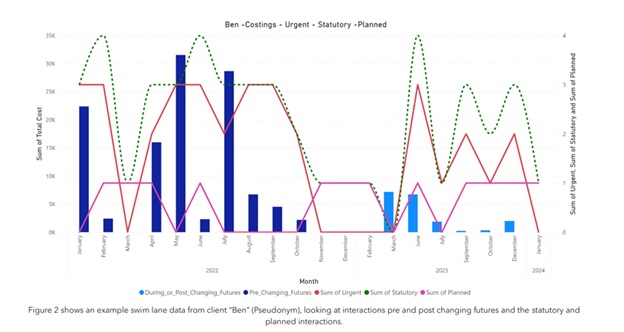
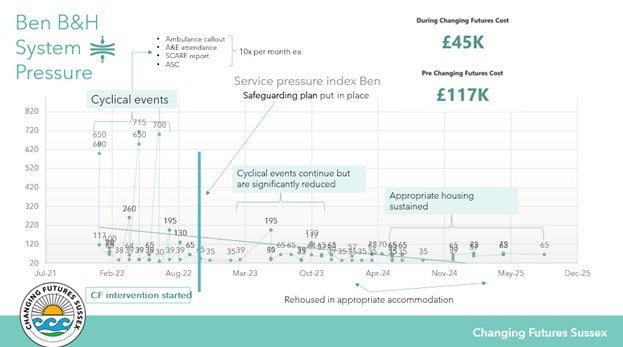
Because of the way the model functions – and provided the necessary data is available – input can be done in real time. We can then see the live progress of beneficiaries (see the case of ‘Ben’ in the image below), helping us to complete the picture. Further work will be required to address emerging gaps identified through testing the tool as the wider work progresses.
This pressure-mapping tool offers a solution by linking person-centred data across systems to identify trends and demonstrate how changes in prevention and community services reduce the high-intensity use of urgent care services. Through longer-term, person-centred support provided by the Changing Futures teams across Sussex, the image for Ben’s progress also shows the impact on services pre/post support.
What new insight does this generate about the system?
The Pressure Matrix allows us to demonstrate how a trauma-informed service for people experiencing multiple disadvantage reduces systemic costs and pressure. Using the example from our first blog, where an individual was helped to access a GP rather than attend A&E for a non-urgent issue, we now see a reduction in peak spikes of demand and impact on staffing, and an understanding of what planned services that individual was diverted into.
Emergent challenges
The main challenge we face in Sussex with the Pressure Matrix is access to data and pre-existing system contradictions which mean that drawing data from organisation X into silo X is much easier than sharing, and gives an impression of success just within organisation / resource X. So often, we see favourable data pulled to meet service or commissioning requirements. In contrast, this tool provides a system-linked, easy to interpret approach that can be used alongside other datasets to demonstrate realised benefits and potential system savings as a result of downstream interventions.
It also has the potential to create a pre-emptive narrative for Multi-Disciplinary Teams and other areas of work seeking solutions for complex cases. The service usage of our same client, Ben, is below, with a longer time index version of pre and post Changing Futures costings and reductions in systems pressure over time.
So what?
In Sussex, we understand this project as having evolved through several phases: from static journey maps to cost-avoidance models, to axis-based interventions, and now to pressure mapping. It begins to articulate the complexity of the system as experienced by real people. We can see service relationships, the cliff edges of support, and the need for systemic responsiveness to lived experience.
To understand cost, we must first understand context. We can’t continue to segment, silo, and specialise in the ways the current system encourages us to. So where do we go from here?
As we continue to evolve the Pressure Matrix, we need input and collaboration across sectors. It is totally dependent on access to data across services. A systems-based approach to multiple disadvantage is everyone’s remit. It requires dropping of egos, scarcity thinking and competition mindsets.
Our ambition in Sussex
In Sussex, we are already in a position more orientated to strong systems thinking than when this paper began—particularly with developments around the Sussex Integrated Dataset (SID). If this process can be integrated into SID, it can accelerate learning and traction—and bring SID closer to its intended purpose: connecting partners through shared data. We also need a demonstrable, analytical framework that can meaningfully align with Integrated Care Board (ICB) priorities: high-intensity use, health inequalities, and urgent care.
System-wide consensus is increasingly difficult in modern health and social care. Solutions may be controversial. Multiple stakeholders, differing metrics, and clashing priorities often cause trust breakdowns and reinforce silos. Issues like co-occurring substance use and mental health are as complex as climate change or pollution—and need to be approached with the same systems-thinking mindset.
The Pressure Matrix continues to evolve in Sussex with support from local and national partners. We continue to see parallel work in Lincolnshire and Northumbria. Our challenge to the rest of the system is that all partners lean into the “common mess,” and not shy away from it. This requires a different kind of leadership, one that understands geography, culture, and empathy between silos. It’s about becoming more human, genuinely convening systems, managing risk positively, and acting because it’s the right thing to do.
[1] For more information about journey maps as a tool see local.gov.uk and UK Government’s designnotes blog.